Alerts
Ding, ding! You've got an alert! 🔔 It's crucial to have a set of good alerts when doing operations. Kubernetes clusters at Gjensidige are set up with Prometheus and Alertmanager making it easy to create alerts for your workloads.
Default alerts
A set of default alerts are already present and will trigger on issues with your workloads. You can get an overview of all default alerts at the Kubernetes Monitoring Runbook 📖 When an alert related to one of your workloads is triggered, a Slack message will be sent to the alert channel specified with slack_alert_channel in namespaces.<cluster>.<env>.tfvars in the repo terraform-aks.
Recommended additional alerts
You can define alert rules in addition to the default alerts by using the PrometheusRule resource. Below is a set of recommended rules if you have an Ingress configured for your workload. If you are using Spring Boot with Spring Boot Actuator, we recommend using the alerts from this guide.
You should always add the label namespace to your alert rules. This will ensure that Slack messages are routed to the channel defined for your namespace in the terraform-aks repo.
apiVersion: monitoring.coreos.com/v1
kind: PrometheusRule
metadata:
  name: "your-app-name"
  namespace: "your-namespace"
  labels:
    app: "your-app-name"
    role: "alert-rules"
spec:
  groups:
    - name: "your-namespace.your-app-name"
      rules:
        - alert: "HighAmountOfHTTPServerErrors" # Trigger if 1% of requests result in a 5** response
          annotations:
            description: "High amount of HTTP server errors in '{{ $labels.container }}' in namespace '{{ $labels.namespace }}'"
            summary: "High amount of HTTP server errors"
          expr: "(100 * sum by (ingress) (rate(nginx_ingress_controller_request_duration_seconds_count{exported_namespace='your-namespace',ingress='your-ingress-name',status=~'5.+'}[3m])) / sum by (ingress) (rate(nginx_ingress_controller_request_duration_seconds_count{exported_namespace='your-namespace',ingress='your-ingress-name'}[3m]))) > 1"
          for: "3m"
          labels:
            severity: "warning"
            namespace: "your-namespace" # Important to route Slack messages to correct channel
        - alert: "HighAmountOfHTTPClientErrors" # Trigger if 10% of requests result in a 4** response
          annotations:
            description: "High amount of HTTP client errors in '{{ $labels.container }}' in namespace '{{ $labels.namespace }}'"
            summary: "High amount of HTTP client errors"
          expr: "(100 * sum by (ingress) (rate(nginx_ingress_controller_request_duration_seconds_count{exported_namespace='your-namespace',ingress='your-ingress-name',status=~'4.+'}[3m])) / sum by (ingress) (rate(nginx_ingress_controller_request_duration_seconds_count{exported_namespace='your-namespace',ingress='your-ingress-name'}[3m]))) > 10"
          for: "3m"
          labels:
            severity: "warning"
            namespace: "your-namespace" # Important to route Slack messages to correct channel
Opsgenie
We are using OpsGenie to truncate the alerts. This means that for an open alert, only a single notification will be sent to the teams Slack channel. Alertmanager will still send notifications as long as the alert is open, but this will be picked up by OpsGenie and recognized as the "same" alert, and therefore a new notification will not be sent to Slack.
Using OpsGenie Alert messages in Slack, team-members can also acknowledge and close the alert.
- Acknowledge to let others in your team know that the alert is being looked at or handled.
- Close if the alert is no longer relevant and not auto-resolved. (Note that if the conditions for the alert triggering in the first place is not solved, it will trigger a new notification of the same kind)
Separate alert channels
There is also the possibility to set up custom alert channels per deployment. If you don't want to flood the general team-alert-channel, or you need something more specific for certain applications. You can set up your Slack channels and then
If you are using a ServiceMonitor
- yaml
- app-template-libsonnet
apiVersion: v1
kind: Service
metadata:
  name: my-service
  labels:
    slack_alert_channel: 'team-<name>-custom-service-alerts-test'
---
apiVersion: monitoring.coreos.com/v1
kind: ServiceMonitor
metadata:
  name: my-service
spec:
  targetLabels:
    - slack_alert_channel
k8s_service+:: {
    labels: {
      slack_alert_channel: 'team-shadow-custom-service-alerts-test',
    },
}
If you are using a PodMonitor
- yaml
- app-template-jsonnet
apiVersion: apps/v1
kind: Deployment
metadata:
  name: my-deployment
  labels:
    slack_alert_channel: 'team-<name>-custom-service-alerts-test'
---
apiVersion: monitoring.coreos.com/v1
kind: PodMonitor
metadata:
  name: my-deployment
spec:
  targetLabels:
    - slack_alert_channel
k8s_deployment+:: {
    labels: {
      slack_alert_channel: 'team-shadow-custom-service-alerts-test',
    }
}
You will also need to ask #team-platform to set up the OpsGenie integration for your Slack channel.
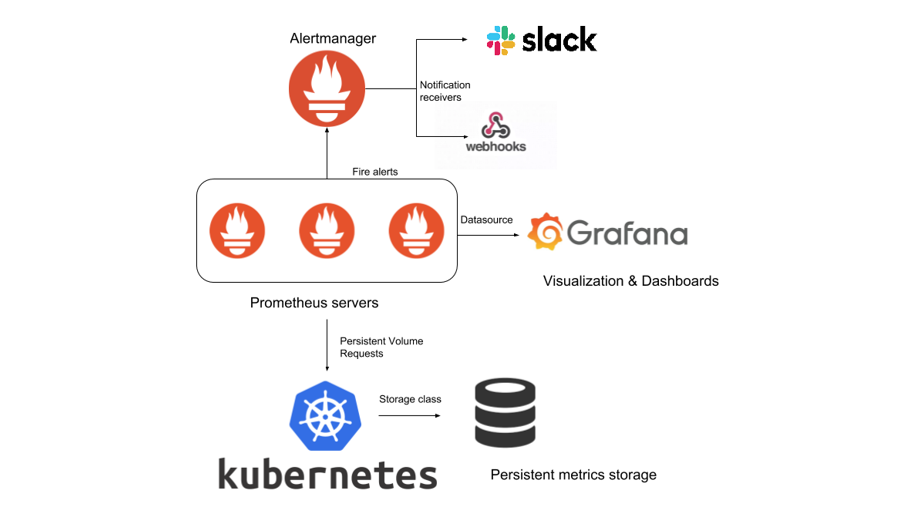
Architecture overview