Alerts
Ding, ding! You've got an alert! 🔔 It's crucial to have a set of good alerts when doing operations. Kubernetes clusters at Gjensidige are set up with Prometheus and Alertmanager making it easy to create alerts for your workloads.
Prometheus and Loki alerts
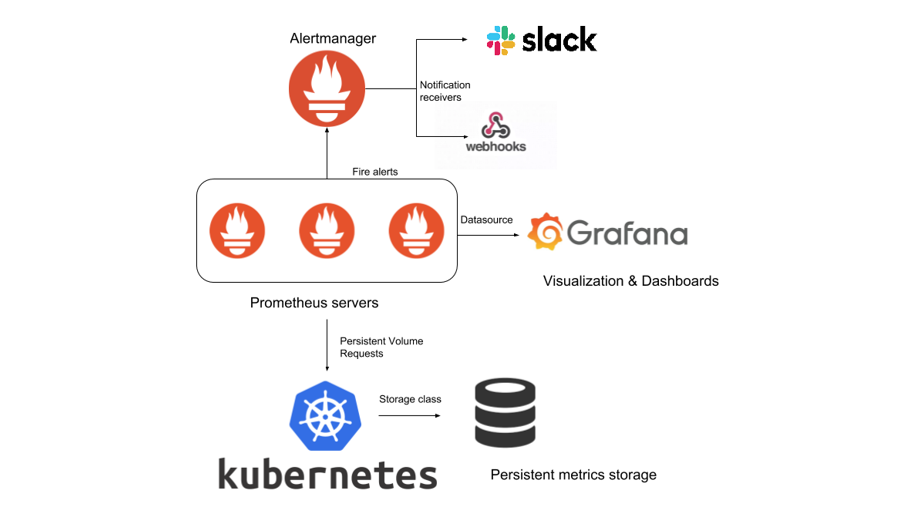
Prometheus alerts are based on your application's Prometheus metrics and use PromQL (Prometheus Query Language). Loki alerts are based on application logs and use LogQL (Grafana Loki's query language inspired by PromQL). Both types of alerting rules are constantly evaluated by the respective Prometheus and Loki Rulers. If a rule starts firing, the Ruler sends it to Alertmanager, which further sends alerts to Opsgenie.
Opsgenie
We are using OpsGenie to consolide the alerts. This means that for an open alert, only a single notification will be sent to the teams Slack channel. Alertmanager will still send notifications as long as the alert is open, but this will be picked up by OpsGenie and recognized as the "same" alert, and therefore a new notification will not be sent to Slack.
Using OpsGenie Alert messages in Slack, team-members can also acknowledge and close the alert.
- Acknowledge to let others in your team know that the alert is being looked at or handled.
- Close if the alert is no longer relevant and not auto-resolved. (Note that if the conditions for the alert triggering in the first place is not solved, it will trigger a new notification of the same kind)
Trunking prometheus alerts via Opsgenie:
Steps to active pr. team/namespace:
- Manually create slack integration pr. channel in Opsgenie integration UI, create under teams → team-alerts → integrations
- When creating a new integration, it immediately sends ALL alerts to that, so a quick tip is to set the matching for Tag → Contains > "new-slack-alert-channel-name" and save.
- Under Alert actions, only check the actions for:
- Create
- Unacknowledge
- Acknowledge
- Add Note
- Close
Opt-in on requests:
- Add PlatformBot to channel: Done manually in the specific Slack channel.
- Add team channels to json file in platform-teambot repo for alert summary every morning
Architecture overview